Under the hood of US equities: Perspectives on size, sectors and style
Large-cap, growth and tech-oriented companies have led U.S. equity market performance so far in 2024. Investors’ optimism for the application of artificial intelligence on these companies’ growth prospects propelled the S&P 500® Top 50, S&P 500 Information Technology, S&P 500 Communication Services and S&P 500 Growth to more than 20% year-to-date gains through the end of August.
4 View gallery


Large-cap, growth and tech-orientated stocks are leading 2024 YTD.
(S&P Dow Jones Indices LLC. Data as of Aug. 30, 2024)
However, the year-to-date performance masks the fact that there has been a notable shift in leadership since the end of June. Indeed, market participants re-evaluated AI opportunities at the start of H2 2024, focusing on capacity demand for chips, potential opportunities for business use and whether the expectation from AI will translate into general economic growth in the short and medium term. This provided headwinds for H1’s performance leaders.
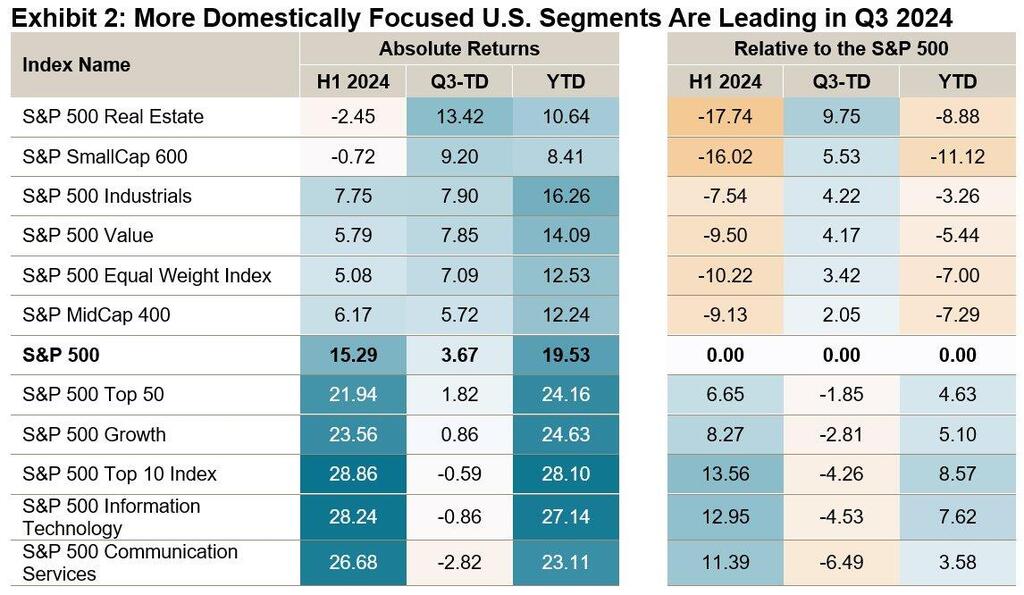
Instead, more domestically focused U.S. segments such as Real Estate, value and small size have led the way in Q3. The S&P SmallCap 600® is outperforming the S&P 500 by about 6%, with the S&P MidCap 400® and S&P 500 Equal Weight Index leading by 2% and 3%, respectively.
4 View gallery


More domestically focused U.S. segments are leading in Q3 2024.
(S&P Dow Jones Indices LLC. Data as of Aug. 30, 2024)
It’s difficult to know whether these trends will continue, but what we have seen historically is that rotations in market leadership across U.S. market cap indices, sectors and style segments are common. The differences in performance in the two parts of the year also show that segments of the U.S. equity market can perform distinctly from the S&P 500, creating opportunities for diversification within the U.S. equity universe.
4 View gallery


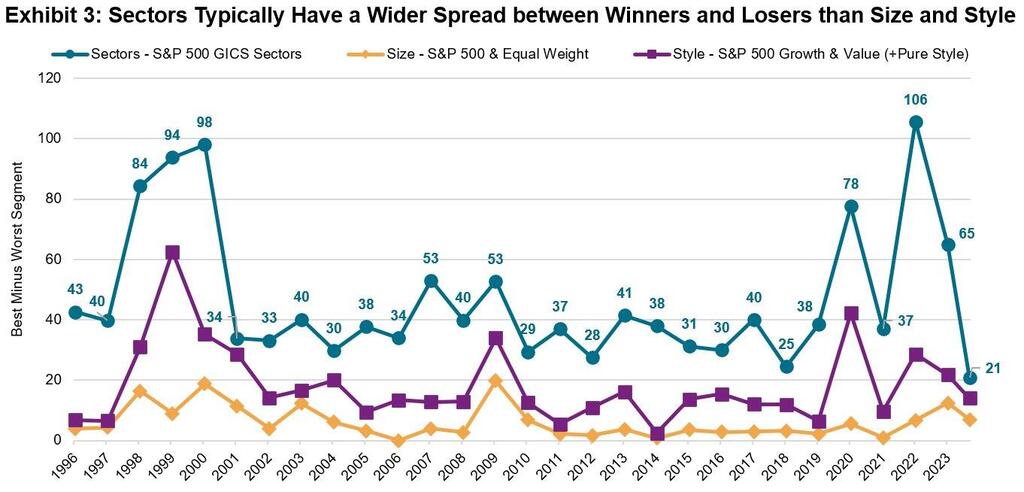
Sectors typically have a wider spread between winners and losers than size and style.
(S&P Dow Jones Indices LLC. Data as of Aug. 30, 2024)
Recent years have been marked by higher dispersion among sector, style and size, with sectors being the most elevated in comparison to history. In 2022, S&P 500 Sectors exhibited their highest calendar year dispersion on record, with a spread of 106% between the best-performing sector (Energy, 86%) and worst-performing sector (Communication Services, -40%), compared with the previous record of 98% from 2000. Sectors remain a useful tool regardless of whether market participants choose to be active or passive.
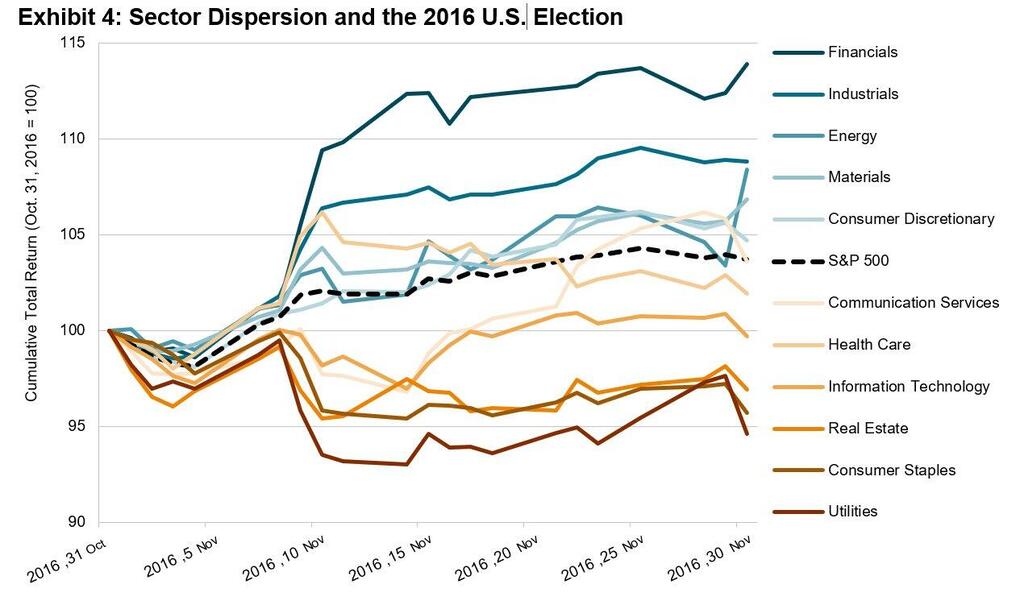
Elevated sector dispersion has also been seen historically in U.S. presidential elections, with November election months exhibiting significantly higher dispersion than other months and non-election periods. Exhibit 4 shows dispersion at the sector level despite limited benchmark volatility. In 2016, sector effects accounted for over 40% of the S&P 500’s monthly dispersion; at the time markets priced in the anticipated impact of the then-incoming administration’s policies on different market segments. It will be interesting to see whether a similar trend emerges in the 2024 U.S. presidential election, but history points to sector effects playing an important role, amplifying the importance of sector choices.
4 View gallery


Sector dispersion and the 2016 U.S. election.
(S&P Dow Jones Indices LLC. Data based on daily total returns between Oct. 31, 2016, and Nov. 30, 2016.)
Recent changes to market leadership remind us that change is a constant of the markets. However, being equipped with a full range of index-based tools can help market participants manage and potentially mitigate risks across different market regimes.
______
Nelesen, Joseph and Edwards, Tim, “Natural Selection: Tactics and Strategy with Equity Sectors,” S&P Dow Jones Indices, July 2024.
Ganti, Anu and Lazzara, Craig, “Sector Effects During Elections,” S&P Dow Jones Indices, September 2020.
Preston, Hamish, “U.S. Equities and Sectors in Election Years,” S&P Dow Jones Indices, July 2024.
____
S&P Dow Jones Indices Disclaimer:


